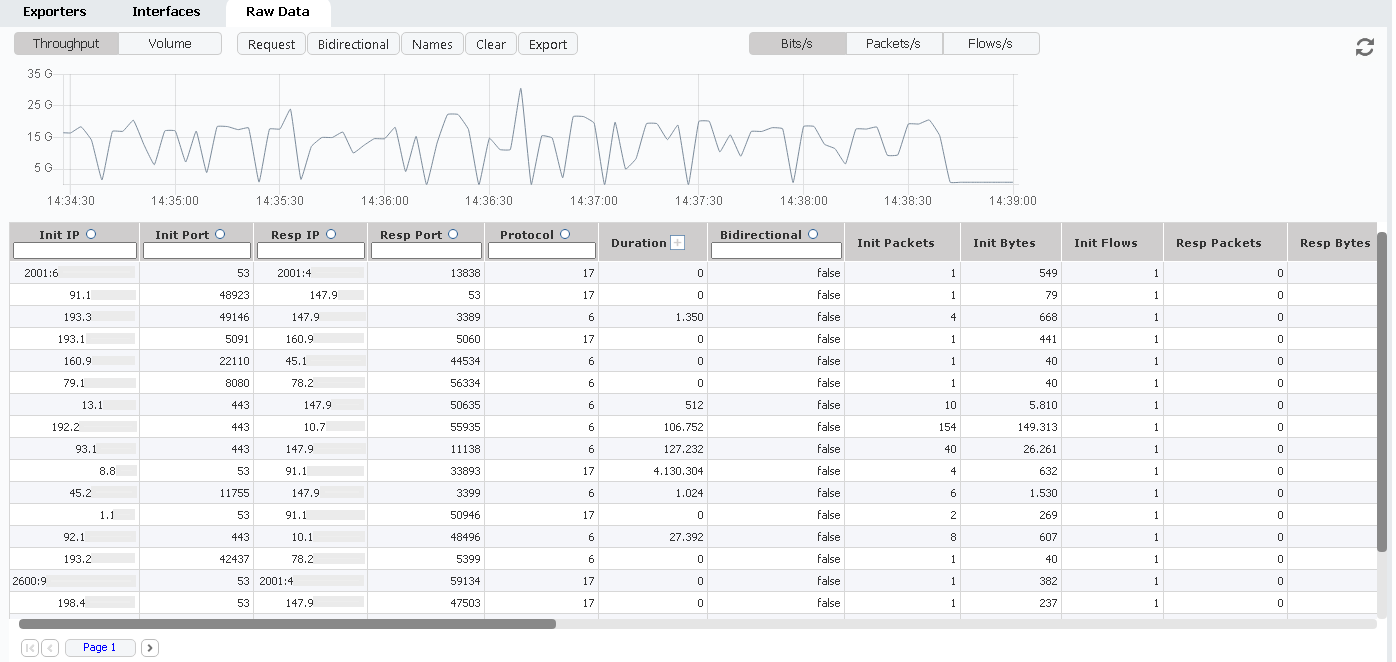
The Raw Data submodule was an indispensable part of NetFlow troubleshooting, especially for cases where information couldn’t be found in the numerous charts and tables within NetVizura.
The main limitation of the current implementation was the handling of 1- or 5-minute files (depending on the aggregation period), which were recorded and compressed directly on the NetVizura machine. In practice, this meant that you could open only up to twelve 5-minute files at a time—effectively allowing you to inspect just one hour of raw data.

Raw Data - Throughput View
If, by any chance, the raw data files were large, the system could run out of memory (OOM), since NetVizura needed to unpack those files and load them into RAM for faster processing. While this setup was far from ideal, it worked reasonably well in most cases.
The next major request from our customers—and by far the most sought-after feature—was the ability to drill down into the traffic. However, since NetVizura only displayed aggregated data, we had to come up with a new approach and adapt the system to handle raw data effectively.
Enter Raw Data 2.0, powered by Elasticsearch 8.
To support this version—and some exciting upcoming features—we needed to adapt both our collector and aggregator components. This required pairing up network conversations on the collector side and presenting those pairs within the Raw Data view.
To achieve this, we introduced a new field called Bidirectional, which indicates that NetVizura has matched both sides of a communication. With this enhancement, Raw Data now distinguishes between initiator and responder traffic, enabling much easier and more precise filtering than before.

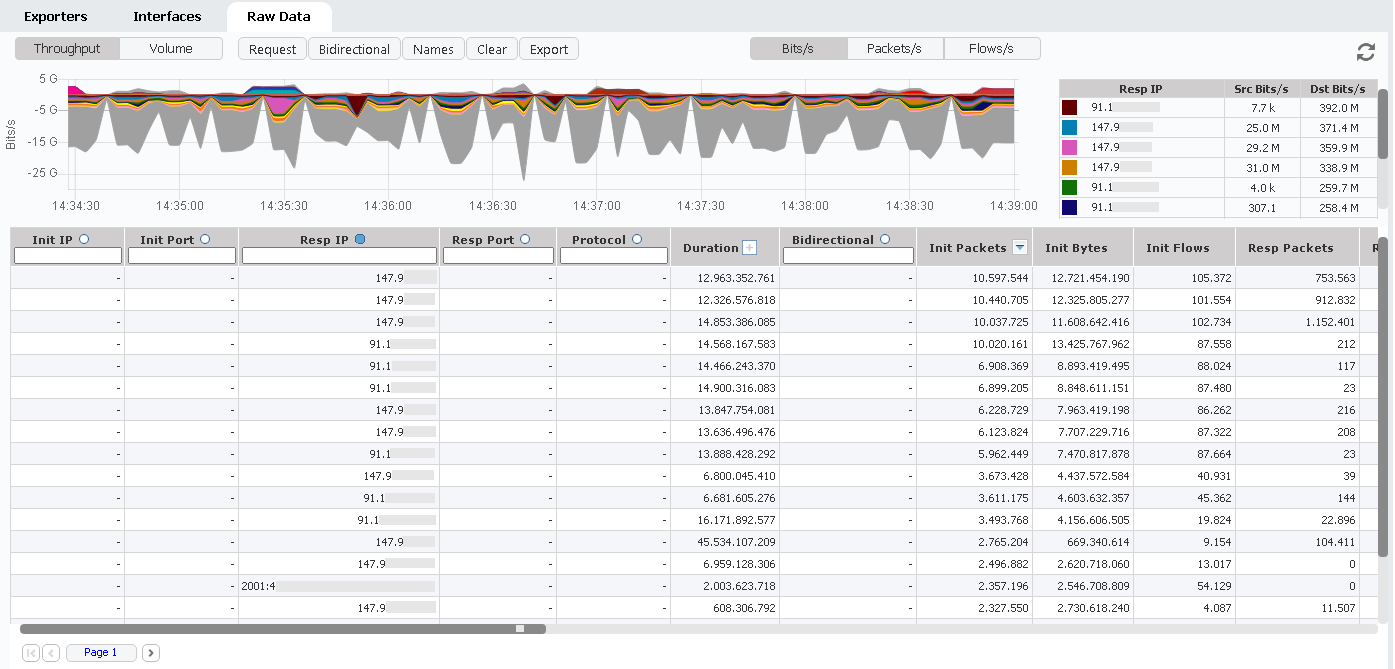
Raw Data - Grouped data
Since raw data is now stored in Elasticsearch instead of local files, it’s much easier to display extended time ranges—such as one, two, or even several days—continuously within the Raw Data view. This new visualization introduces a powerful drill-down capability, allowing you to explore your traffic data in greater depth.
You can now filter the data, group it by any parameter, and instantly generate new tables that display aggregated raw data—something that was previously impossible.
Of course, performance depends on both your Elasticsearch setup and the available RAM on your instance. These parameters can be adjusted in Settings to fine-tune memory usage and optimize performance.
And last but not least, Raw Data 2.0 introduces a new export option to an .xls file, now delivered as a ZIP-compressed package. When exporting, you’ll receive a size estimation prompt, ensuring that the resulting file is both manageable and useful for your needs.
All data within Elasticsearch is zstd-optimized, minimizing the raw data footprint inside the database. And in cases where data volume grows too large, you can configure a remote Elasticsearch cluster directly from the Settings, providing flexible scalability for larger deployments.
The new version of Raw Data will be available to you as part of NetVizura 6.0, so stay tuned—it’s coming soon.


