


We inspire each other to create true value together
-
Log Filtering
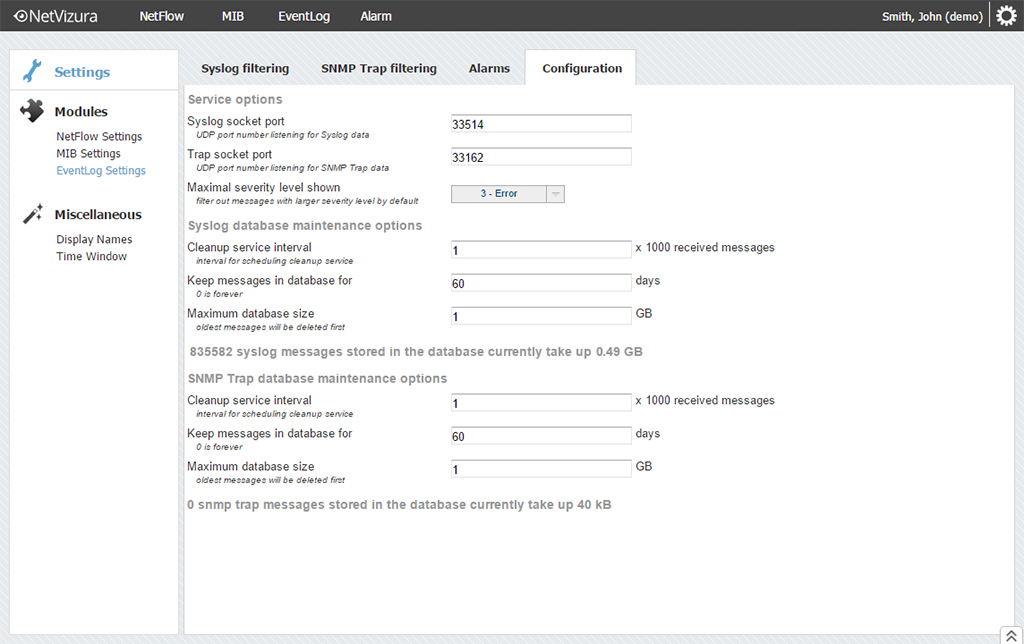
Filter unnecessary logs from processing by creating filters based on source IP, message facility, severity or containing text for Syslog messages and source IP, Trap OID and Variable values for SNMP trap messages.
-
Automated Database Management
All collected logs are stored in the database. You can set the maximum database size and conditions for automatic deletion of oldest data.
-
Visualization
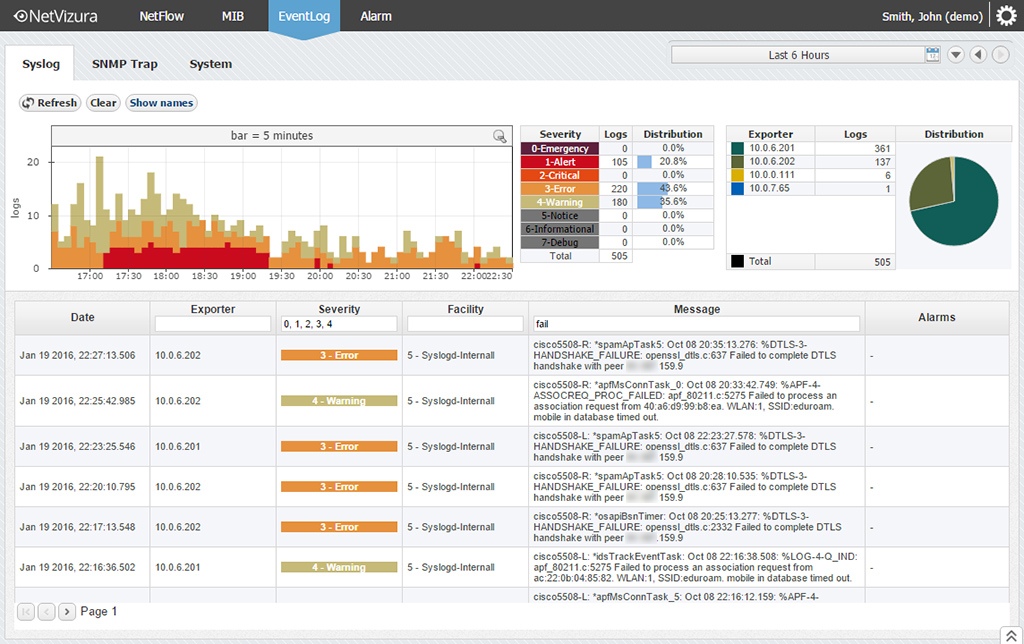
Troubleshoot faster - Drill down into logs of any monitored device by using filters and zooming in on relevant time.
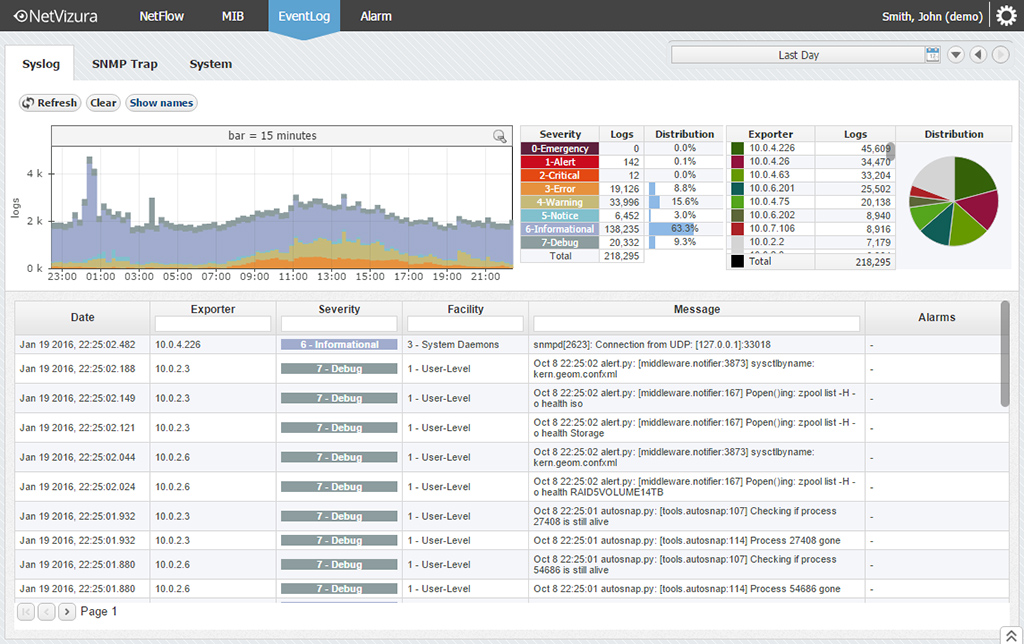
Analyze faster - get network health insight at a glance. Log severity levels and device contribution are highlighted on two charts. Color mapping of severity level makes identifying critical logs and their numbers quick.
-
Quick Filters and Search
Get through thousands of logs quickly with one click filters and search options. Filter logs by device IP, log severity, time stamp or log message text in few clicks.
-
Syslog and SNMP Trap Support
Almost any network device can generate logs. NetVizura EventLog Analyzer supports Syslog and SNMP trap message collecting and archiving.
-
Millions of Logs per Hour
Built and tested for millions of logs per hour or more than 20,000 logs per second - get whole of your network devices covered!
-
Alarms
Gain faster reaction speed by alarms based on Syslog message and SNMP trap message characteristics.
Syslog alarm triggers if message severity, facility, text or source IP (or their combination) is matched. SNMP Trap alarm triggers if message Trap OID, variable values or source IP (or their combination) is matched. All alarms are accessed from Alarm dashboard allowing quick jumps to objects that triggered the alarm.


