Usually, our customers configure NetFlow export directly on their devices (routers, switches, firewalls, etc). But in case the company policy (especially in Asian countries) prevents enabling export on devices, or if devices are not capable of exporting NetFlow data, we need to implement a NetFlow probe. There are paid probe software options available, however, we will focus on an open-source NetFlow probe called softflowd. To learn more about softflowd visit their github page: GitHub softflowd. Also, note that the package is available in almost all Linux distributions.
Architecture
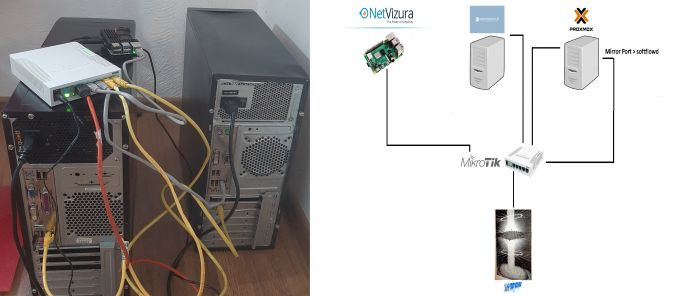
Since this is a real-world example, every part of the architecture is a physical device:
- NetVizura NetFlow Analyzer, our NetFlow collector and visualizer, is on Raspberry Pi 4 (check out our blog to learn more about how to configure NetVizura on Raspberry Pi 4)
- Two physical machines, OpenMediaVault NAS and Proxmox Hypervisor, that are producing traffic and are useful for NetFlow metric
- MikroTik switch, RB260GS, a simple switch that allows port mirroring, a must-have in our case.
To have a better idea of the architecture described above, take a look at the following visual representation:
Configuration
At the beginning, we are going to configure MikroTik switch:
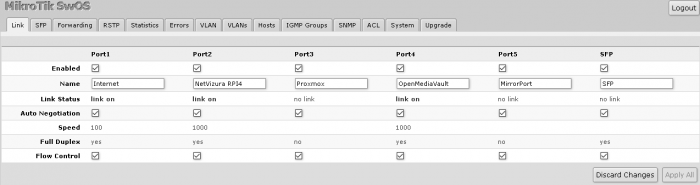
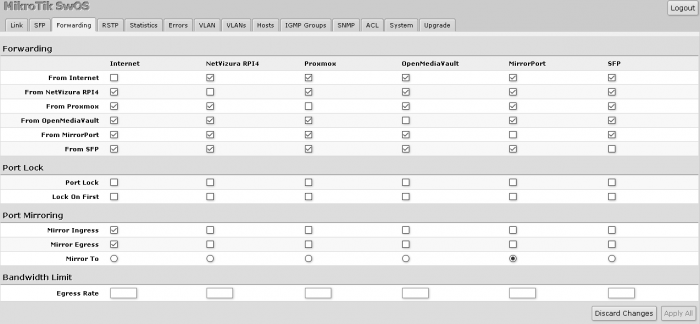
We have set port mirroring for port 1/Internet to port 5 in both ingress and egress. Since this is a SwOS software, configurations are somewhat simple, and, in our case, this is everything we need to set here.
Next, we need to install and configure softflowd. To do so, we have added a network card in Proxmox to collect the traffic and send NetFlow packets to NetVizura. As Proxmox is a Debian-based appliance, we can install softflowd with apt install softflowd –y. If you need a newer version than in repos, you can always get it online, and then install it with dpkg –I *.deb file. For the configuration of softflowd we need to edit /etc/softflowd/default.conf file. Let's use an example:
interface='enp2s0'
options='-n 192.168.8.182:2055'
As with any complex software, there are numerous options and flags, so we will not go deeper into softflowd configuration, since here we have done sufficient to get data flowing.
Testing
Once the configuration is completed, we need to see if there is any traffic coming to NetVizura. Previously, if you want to debug softflowd, two commands output information information about it:
softflowctl -c default.ctl statistics
and
softflowctl -c default.ctl dump-flows
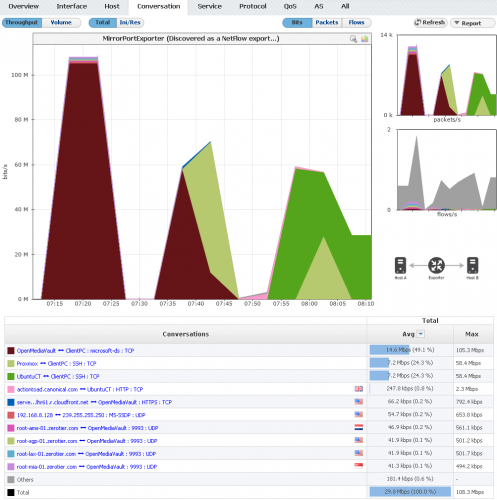
Now, we can go to the NetVizura NetFlow Analyzer, and check whether the traffic is present. As you can see in the screenshot above, everything going through the Internet port is being collected. The Ubuntu container is getting updates from Cannonical, OpenMediaVault serving files via Samba, ssh copying files, etc.


