Mikrotik devices are feature-rich and wallet-lite and that makes them one of the most used devices in the Europe and the rest of the World. Numerous SOHO and SMB companies use them for great graphical interfaces (winbox) and their huge customization list, which comes from their in-house RouterOS and SwitchOS which can also be installed on regular PCs. The feature list extends to NetFlow and EventLog support which we will configure here.
NetFlow Configuration
Mikrotik has Traffic-Flow submenu, which supports NetFlow versions 1,5 and 9. You can access that submenu with /ip traffic-flow. To enable NetFlow type set enabled=yes inside /ip traffic-flow.
Properties that are configurable here:
| Interfaces: | All interfaces from which you want to collect NetFlow data. By default it is set to all. |
| Cache-entries: | Number of flows that the router can store in memory at once. Default is 4k. |
| Active-Flow-Timeout: | Maximum timeout of a flow. Default is 30minutes. |
| Inactive-Flow-Timeout: | Period in seconds in which the flow is active. If the connection doesn't receive a packet in that time period, traffic-flow will send packet as a new flow. Default is 15 seconds. |
Now we can configure NetFlow sender and receiver with add command and following options:
| Src-address: | Source address which you will see in NetFlow collector as your exporter IP. |
| Dst-address: | NetFlow collector IP address. |
| Port: | NetFlow collector port on which it is listening. Usually it is 2055. |
| Version: | NetFlow packet version. |
| V9-template-refresh: | Number of packets after which template is sent. Only for NetFlow v9 default is 20. |
| V9-template-timeout: | It means - If template has not been sent, send it after this value. |
With these configurations set, you should see traffic flowing on your NetFlow collector.
EventLog Configuration
Unlike NetFlow configuration, EventLog can be configured via GUI and that makes our job somewhat easier. Configuration is done in System/Logging, so let's proceed to it.
At first we need to create rule for logging, via add button. Here we add topics for logging and sometimes for excluding. Prefix is just name for the rule, so that you can navigate easily through them. In the action section, we choose remote. Then, we jump to Actions tab and edit remote action. Here we need to add Remote address and port, which are from our EventLog collector source address, in order to distinguish this Mikrotik device. We need to check BSD Syslog so that Mikrotik sends RFC format messages to our collector. Syslog facility and severity are Syslog fields which will be shown in our EventLog collector.
An example of the complete configuration can be seen on our image:
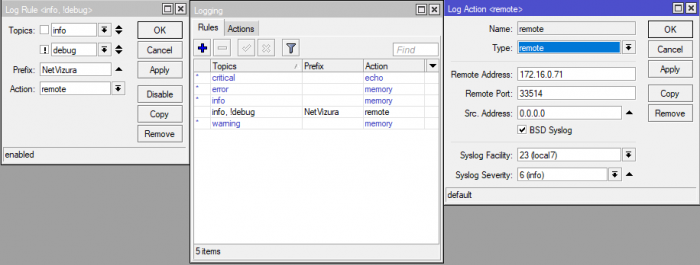
With this configuration you should see your messages on EventLog collector and you can start monitoring and alerting on them!


