Fortinet is one of the most used Next Gen Firewalls in the world. It is hard not to be immediately attracted to full integration of end-to-end security across the whole network infrastructure. This is conducted via modules, that are easily enabled. Also GUI is very intuitive, although NetFlow and Syslog configuration do require some additional effort.
NetFlow Configuration
Fortinet (and Fortigate/FortiOS) NetFlow configuration is enabled from CLI via few commands:
config system netflow
set collector-ip 172.16.0.71
set collector-port 2055;
set active-flow-timeout 1
set inactive-flow-timeout 15
end
In the newer version, however, the following commands are used to enable NetFlow configuration:
config system netflow
    set active-flow-timeout 60
    set inactive-flow-timeout 15
    set template-tx-timeout 1800
    set template-tx-counter 20
    config collectors
        edit 1
            set collector-ip "172.16.4.225"
            set collector-port 2055
            set source-ip "172.16.0.223"
            set interface-select-method auto
end
In our example below you may find all the NetFlow parameters that are configurable:
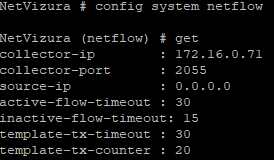
Next step would be to set NetFlow collecting on all the interfaces you wish to monitor:
config system interface
edit port1
set netflow-sampler both
end
Once you have gone through the simple settings mentioned before, NetFlow traffic should appear in your NetFlow collector.
However, if there are some issues and NetFlow data are not emerging, then you can diagnose traffic with these two commands:
diagnose sniffer packet | grep 2055
diagnose sniffer packet | grep 172.16.0.71
As grep you can use port or collector IP. Moreover, NetFlow configuration can be checked with two more commands:
diagnose test application sflowd 3
diagnose test application sflowd 4
In the following example, you may see how we did it:
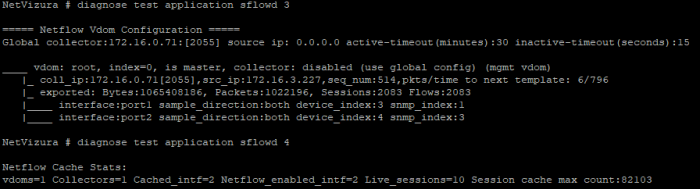
EventLog Configuration
To configure EventLog export, we need to go through a few steps before we have messages in our EventLog Analyzer so let's start. Firstly, we need to define Syslog settings:
config log syslogd setting
set status enable
set port 514
set server 172.16.0.71
set reliable disable
set facility user
end
Afterwards, we can check the configuration:
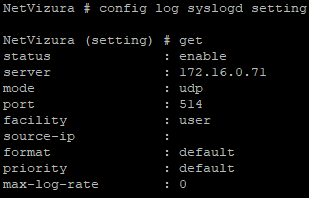
Nevertheless, most Fortigate features are enabled by default:
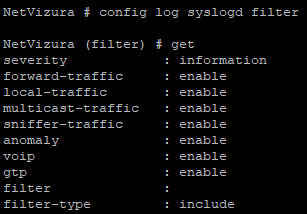
And that is it, your Eventlog collector should now be filled with Fortigate messages.


