Barracuda is one of the most famous security companies in the world. They have started as a spam-blocking hardware device company, but soon they have diversified their portfolio which is now comprised of numerous products, including renowed CloudGen Firewall. This firewall has two types of GUI - Web and Barracuda Firewall Admin console - with myriad of options for configuration and monitoring. We will today configure its monitoring with admin console, to see how accessible and versatile it is.
NetFlow configuration
In order to configure NetFlow (or in this case IPFIX) we need to edit a couple of things:
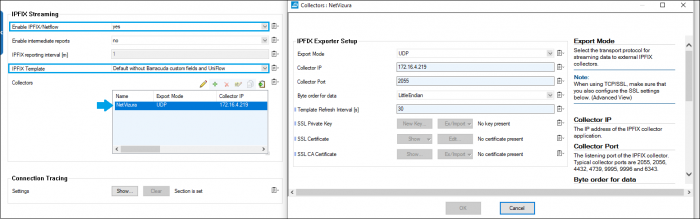
1) Go to Configuration/Configuration Tree/Box/Infrastructure Services/General Firewall configuration, Audit and Reporting. Choose Lock to enter into configuration mode. In the IPFIX Streaming tab, enable IPFIX/Netflow, set IPFIX template to „Default without Barracuda custom fields and UniFlow". Afterwards, add a new type of Collector with your IP address and port and byte order for data set to LittleEndian.
 2) Then go to Configuration mode (included in General Firewall configuration, Audit and Reporting) and switch to Advanced. In the Log Policy tab, enable Generate Audit Log. Also, in the field Audit Log Data press the button Show and in the pop-up set Audit Delivery to Send-IPFIX. Save changes and activate Pending.
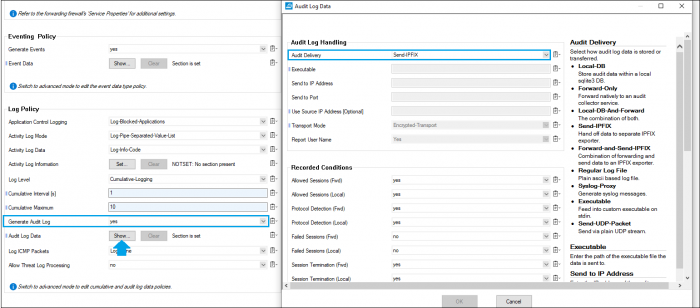
3) And now one optional step - You can create a PASS host firewall rule to allow traffic between the Barracuda CloudGen Firewall and the IPFIX collector.
Flows should now start running into your NetFlow collector.
EventLog configuration
Syslog configuration is a little bit tricky, however if you have succeeded to find your way with the previously described configuration we believe this should be a piece of cake. So let's get started:
1) Firstly, in Configuration/Configuration Tree /Box/ Infrastructure Services/ Syslog Streaming/ Logstream Destinations add a new destination (in our example, we have called it NetVizura). Set Logstream Destination to Explicit and enter destination and port of your NetVizura server in the fields below. In the Data Transfer Setup, Transmission Mode should be UDP. 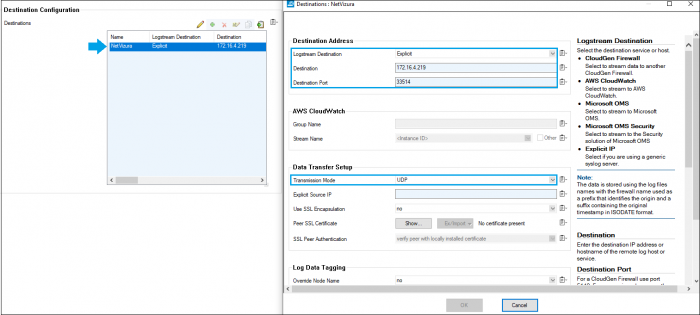
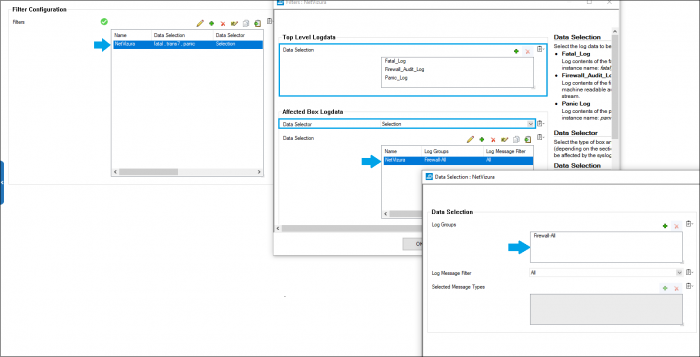
2) Logdata Filters are configurable at the following location:Configuration/Configuration Tree /Box/ Infrastructure Services/ Syslog Streaming/ Logstream Destinations/ Logdata Filters. Add a new Filter (in our example, we have added NetVizura filter). Within created filter, a new set of configuration is order:
- Data selection - usually Firewall_Audit_Log should be enough, however you can add Fatal_Log and Panic_Log as well
- In Affected Box Logdata field you can select data that syslog daemon should send
- Include a new Data Selection (let's say NetVizura) and select categories that should be affected by syslogging. We have selected Firewall-All, although you can pick among many provided options (for example Auth).
3) For the final touch, select Logdata Streams (available in Syslog Streaming tab) and in Logstream Configuration/Stream Configuration Active Stream should be yes and in the fields beneath set your Log Destination and Log Filter.
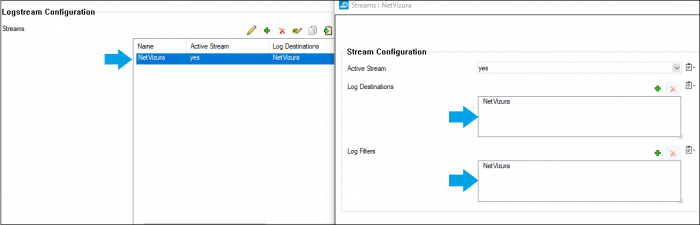
And that is it - EventLog messages should appear in your collector.


