There are situations when you need to get NetFlow statistics, but having a device that does not export Netflow can be a bummer. There is always a solution...
When a network device is not supporting NetFlow protocol, you can use a server with a NetFlow probe to analyze traffic from the network device and to generate a NetFlow statistics.
We will call this server the NetFlow Daemon Server. Figure below shows an example of this situation:
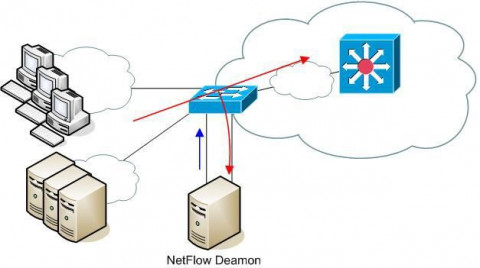
Figure below shows a more detailed illustration. Traffic from uplink interface Gigabit Ethernet 0/0 is forwarded (mirrored) to interface Gigabit Ethernet 0/1, which is connected to the NetFlow Daemon Server. When the port mirroring starts, interface on a switch, to whom all traffic is forwarded to, becomes useless for normal device communication. It only passes all traffic from a mirroring interface. It will not be possible to collect statistics about the local traffic which doesn't pass uplink interface.
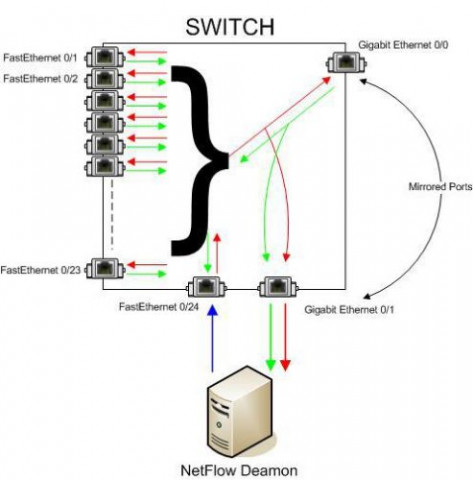
The problem is: How to export NetFlow traffic if the interface, on which the NetFlow Daemon Server is connected to, is unusable for normal communication?
NetFlow Daemon Server must have two network cards, one for receiving mirrored traffic and the other for exporting NetFlow statistics. This configuration enables NetFlow exporting even from L2 switches. The drawback is the additional port utilization on the switch and the need for an additional server with two network cards. The blue arrow in the figure above shows NetFlow export from the additional network card on the server. Now, it is possible to start the NetFlow probe on the NetFlow Daemon Server.
Using NetFlow probe
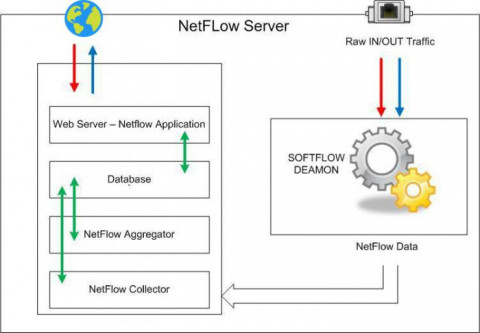
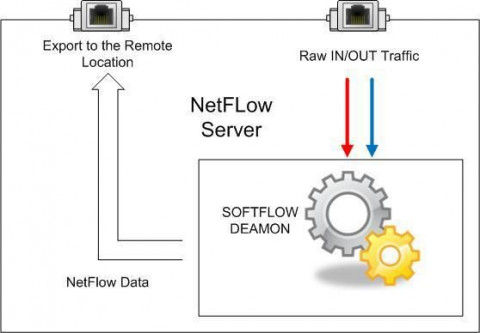
We will show an example of configuration with a free NetFlow probe software called softflowd. It has the possibility of exporting NetFlow traffic locally (127.0.0.1) to an UDP port on the same server or to an UDP port on a remote server.
Exporting NetFlow traffic on the same server
Exporting NetFlow traffic on the remote server
 Configuring SoftFlowd on CentOS 6
Here you can see how to configure the softflowd on CentOS 6. In our example we are using version softflowd-0.9.9.tar.gz.
- Download softflowd and put it in the /root directory
- To install softflowd you should execute the following set of commands:

To be able to run the software in Debug mode in the foreground we should use the following command to ensure that we see the relevant messages:

You can see that the flows are being "recorded" and that they are being exported in NetFlow version 5 and set to in this case 10.10.10.10 using destination port 2055. This can be done using a utility such as TCPDUMP:

Now that you have this option, you just need to prepare everything accordingly and get your NetFlow statistics. It is not a perfect solution, but it might handy when you need some specific interface monitor without data for all exporter. Hopefully it will be helpful...


